Adjust chart padding for Cartesian charts from the Formatting panel, by opening the Settings tab below the Chart dropdown list (ensuring that the chart itself is selected).
Chart Padding by Percentage
Set the padding according to a percentage of the canvas space.
- Chart Padding: set to Percentage.
- Category Padding: affects the padding between each category on the x-axis. Set to 5% by default.
- Series Padding: affects the padding between all segments in the series of member elements. Set to 10% by default.
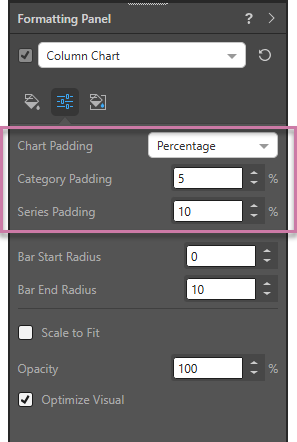
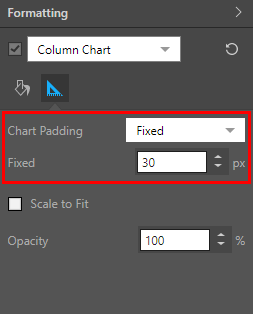
Chart Padding by a Fixed Value
Set the padding according to a given fixed number of pixels; it's set to 30 pixels by default.
- Chart Padding: set to Fixed.
- Fixed: define the number of pixels.
Examples
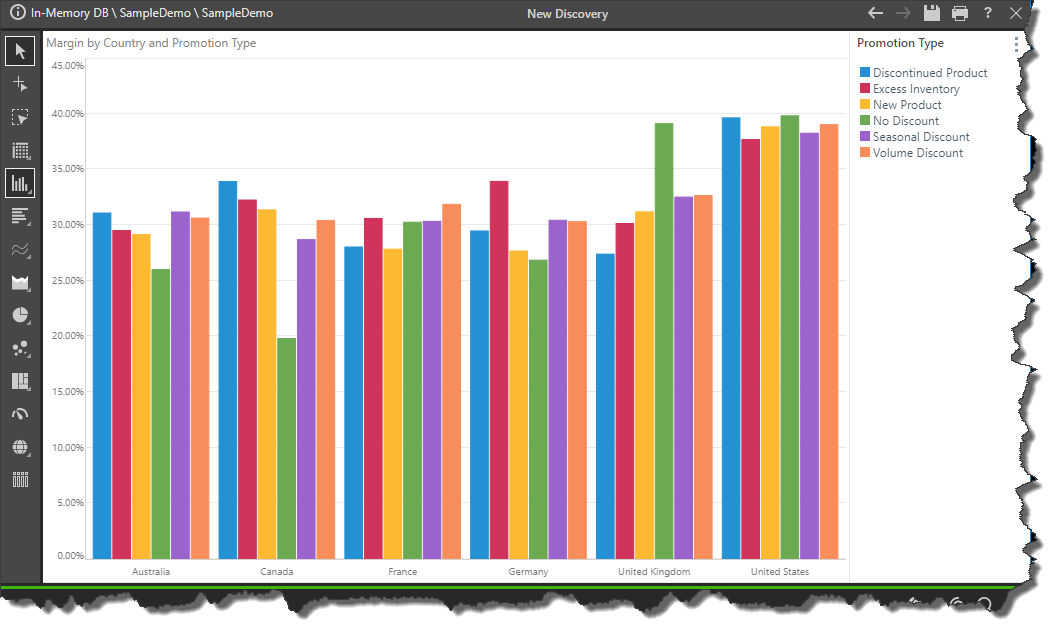
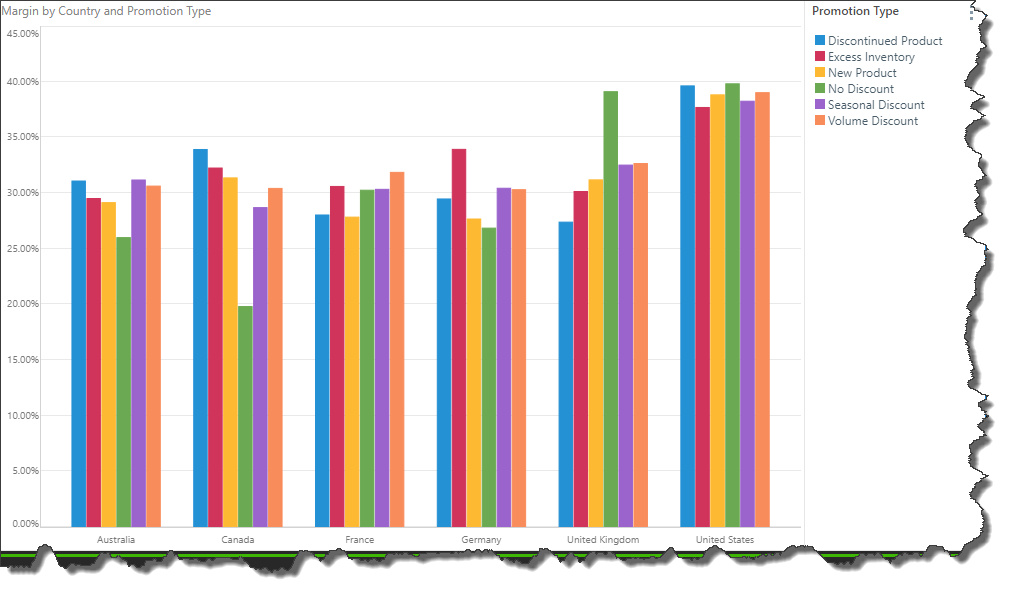
Default Padding
This image shows a column chart with the default padding settings:
Here, the same column chart has been assigned a category padding of 25%; we see this padding in the space between each category on the x-axis. Each group of columns is easily distinguished from the next because of this padding.
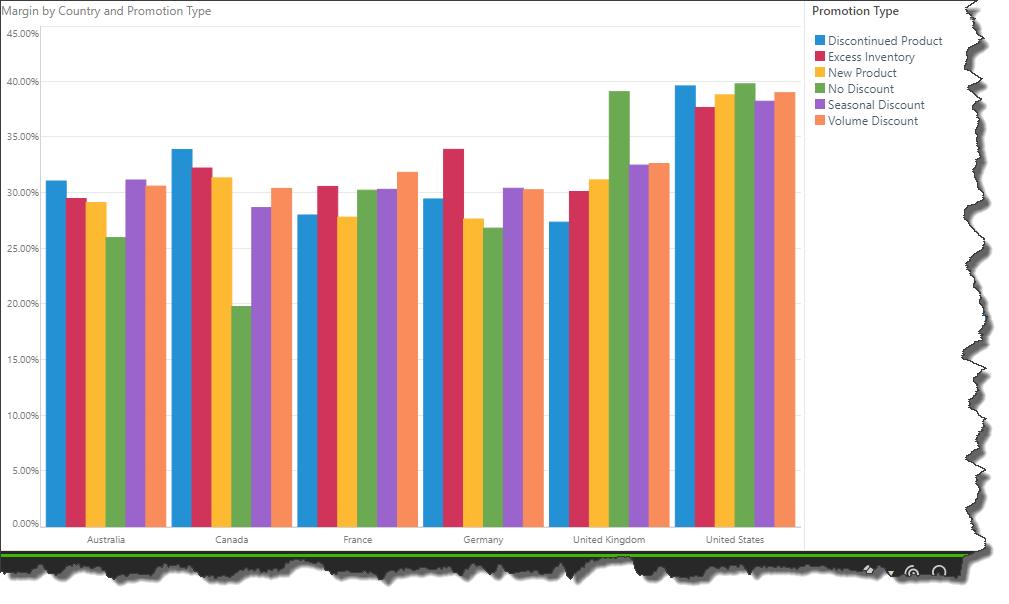
Here the category padding was reduced to 0%, making it harder to identify the different categories.
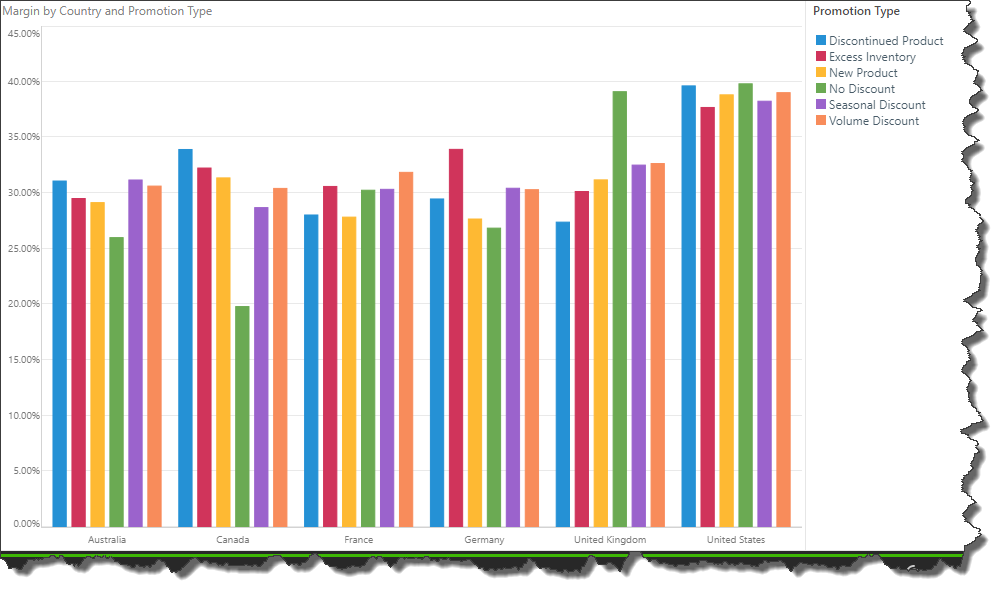
Here to category padding was reset to the default 5%, while the series padding was increased to 30%; we notice a large space between each column within each category.
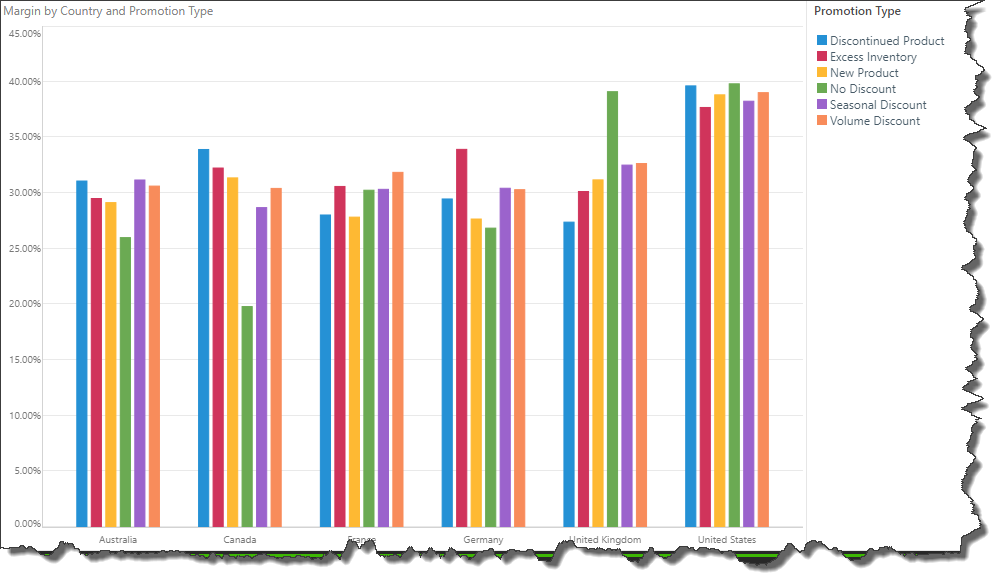
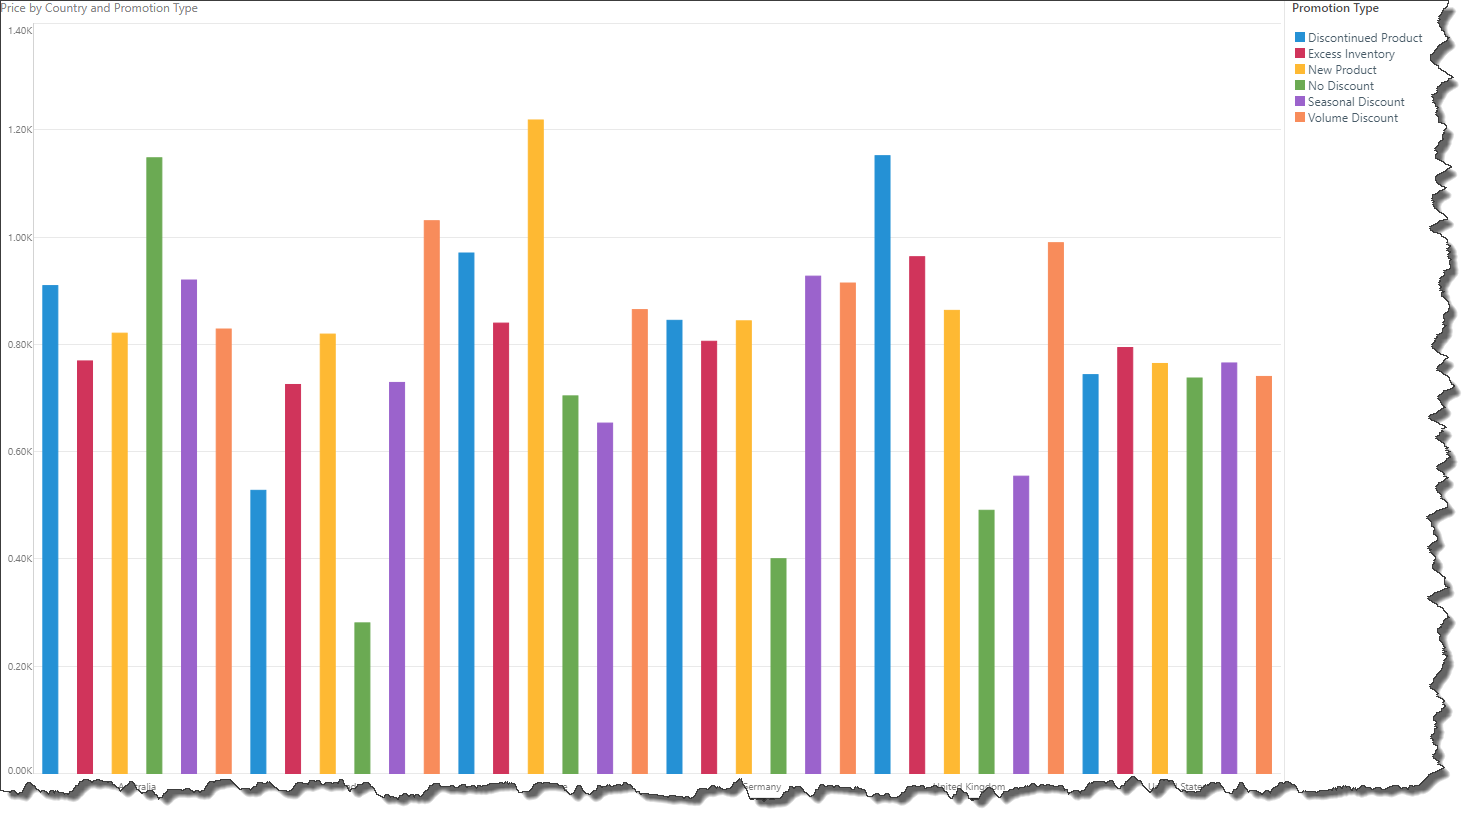
Here, the series padding is 30% and the category padding was adjusted to 25%:
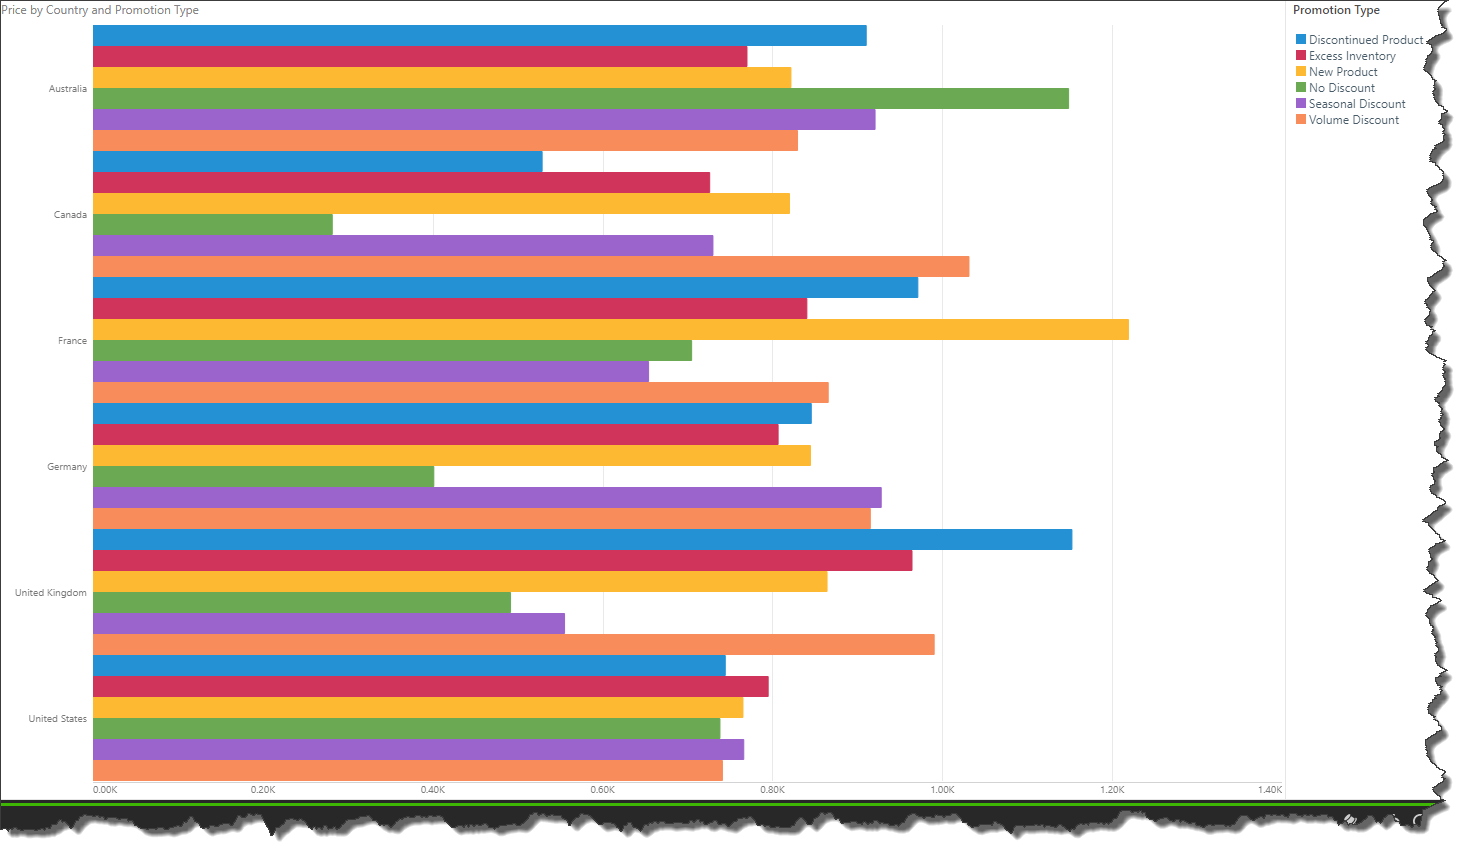
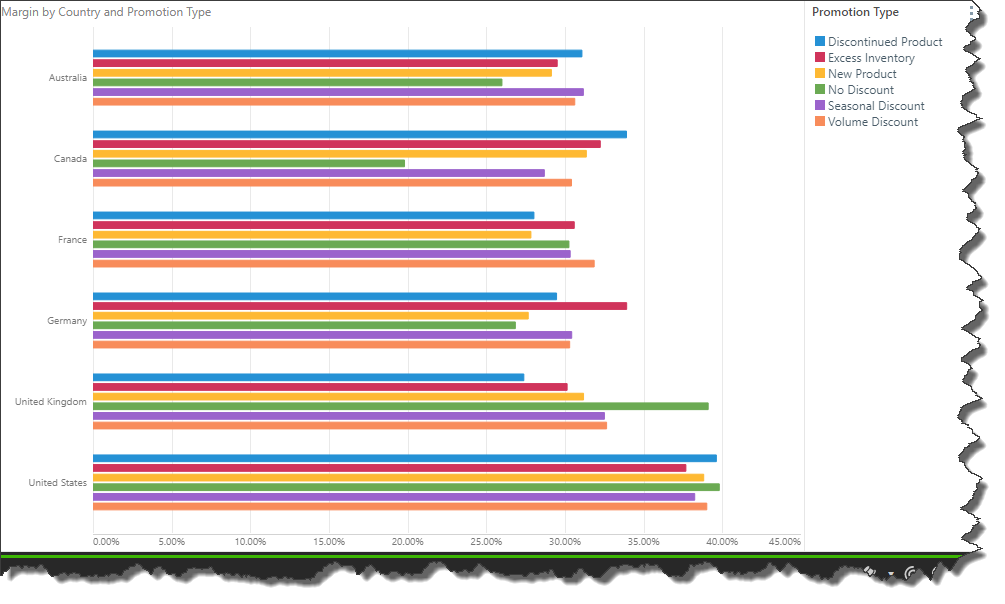
Here the same query and padding settings are displayed as a bar chart:
Fixed Padding
In this example, the padding is set according to a fixed number of pixels; the given number of pixels determines the width of the columns or bars in the chart.
Here the pixels are reduced from 30 (the default) to 15, displaying very narrow columns.
In this bar chart, the fixed number of pixels is 20: